
Challenge.Gov FY23 Year In Review
Welcome to the Challenge.Gov 2023 Year in Review. The annual data we are sharing is for the fiscal year, a common reporting period across the federal government. The data on this page is from the 2023 Fiscal Year (FY23) which began October 1, 2022 and ended September 30, 2023.
This is the second Year in Review snapshot we are sharing with our community. For a quick look at what we accomplished last fiscal year check out the FY22 Year in Review.
Since 2010, Challenge.Gov has supported federal agencies to mature and scale the use of prize competitions and crowdsourcing campaigns to advance their missions. We track data related to federal challenges and prize competitions posted on the Challenge.Gov platform and public engagement with these competitions. We share this information in the spirit of transparency to show the federal government’s collective impact bringing innovative solutions to important public problems.
Key Metrics
Through the combined efforts of federal challenge managers and the Challenge.Gov team, federal prize competitions and engagement on Challenge.Gov increased across multiple key metrics in FY23 compared to the previous year:
↑ 46% Total prize purse
↑ 41% Number of challenge manager accounts
↑ 55% Number of public solver accounts
↑ 50% Number of public newsletter subscribers
↑ 22% Total number of website sessions
↑ 20% Number of website users
Data Definitions
Average: Total prize purse offered divided by the number of challenges that offered cash prizes.
Median: Prize amounts highest to lowest and selecting the middle value.
Accounts: Challenge.Gov offers secure accounts for challenge managers and solvers with access to the user portal.
Session: A user visit to Challenge.Gov. A session ends when a user exits the website or becomes inactive.
Pageviews: Number of times the content on a web page is loaded or reloaded.
Users: Total number of new and returning website visitors.

Federal Challenges in FY23
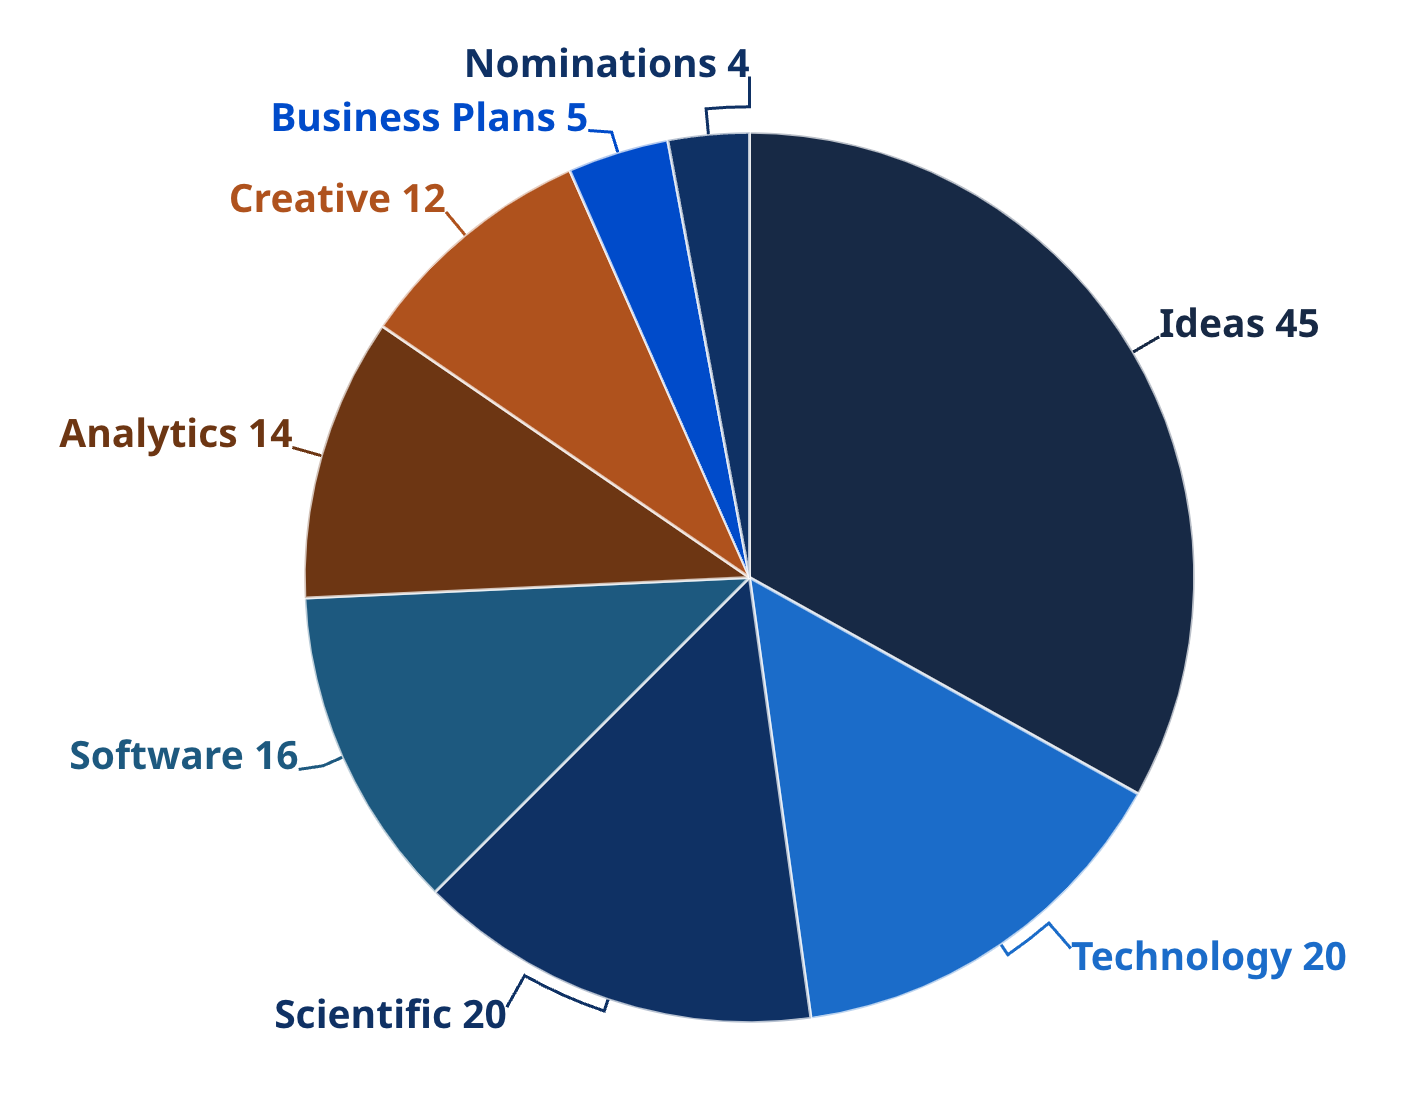
Federal challenge data includes the number, prize amount, agencies, and challenge types for the year. In FY23, the most common type of challenge sought ideas from the public, indicating agencies are leveraging prize competitions as a way to lower barriers to engaging the public and tapping into new audiences.
136 Prize competitions
$173,293,500 Total prize purse
$1,274,217 Average prize
$200,000 Median prize
$22,000,000 Highest prize
24 Non-monetary prizes
19 Agencies
Department of Health and Human Services

Department of Defense

Department of Energy

National Aeronautics and Space Administration
Challenge.Gov Platform Data
Challenge.Gov launched a new platform in October 2022 with a dynamic set of features to facilitate the federal government’s use of prize competitions and engage the public, including secure accounts for federal challenge managers and the public.
297 FY23 Challenge Manager accounts
6,049 FY23 Public Solver accounts
366,608 Total sessions
232,254 Total users
823,087 Total pageviews
Support for Federal Challenge & Prize Community
The Challenge.Gov program supports a thriving federal community of practice with office hours, robust customer support, and practical resources. Through various speaking engagements to both federal and public audiences, the Challenge.Gov team highlights the work of federal challenge managers and advocates for increased use of prize competitions to drive innovation and engage the public.
1,454 Customer service touchpoints
22 Office hours
1,195 Federal newsletter subscribers
10 Speaking engagements
Public Engagement
Social media and content development are key avenues for engaging the public and promoting federal prize competitions. In FY23, Challenge.Gov launched a new YouTube channel to allow our program to expand our production of video content, including short promotional videos for challenges accepting submissions on the site.
7,998 Public newsletter subscribers
806 LinkedIn followers
15,383 Twitter followers
4,232 Facebook followers
873 NEW! YouTube views
Events Approach
The Challenge.Gov program held events featuring challenge managers that provided opportunities for members of the public to ask questions about active challenges on the site. For example, our Challenge Chat format includes a brief, 60 second challenge video promotion and a 20 minute facilitated Q&A with the challenge manager.
7 Public events
290 Total event attendance
41 Average event attendance
Looking Ahead to FY24
The Challenge.Gov program is using these insights to guide the creation of resources, events, and services to share with our community.
Our goals for FY24:
- Revise and update the vision, mission, and values statements for Challenge.Gov and use them to guide our work.
- Develop personas for our audiences to improve service delivery.
- Create new features and capabilities of the Challenge.Gov platform, including an evaluation function for challenge managers.
- Produce additional training assets for both federal challenge managers and members of the public, including how-to videos for using the site and leading practices for public events.